![]() The data for this example
The data for this example
Ali M. Kizilbash, Sheila K. Heinle, and Paul A. Grayburn, "Spontaneous Variability of Left Ventricular Outflow Tract Gradient in Hypertrophic Obstructive Cardiomyopathy," Circulation 1998; 97: 461-466.
![]() Background and conclusion
Background and conclusion
Daily measurements of left ventricular outflow tract (LVOT) in patients with hypertrophic obstructive cardiomyopathy (HOCM) were shown to be highly variable by Grayburn (8) et al. and therefore, a single measurement of pressure gradient is not adequate to define the severity of dynamic LVOT obstruction in HOCM. This data analysis is a further work on the data given in the article by Grayburn (8) et al. and proposes that an increase of 2 to 3 fold for LVOT gradient may be needed to be sure that disease progression occurred whereas a reduction of 1/3 to 1/2 may be needed to be sure that an improvement or therapeutic benefit occurred.
![]() Acknowledgement
Acknowledgement
I would like to thank Dr. Paul A. Grayburn MD, Division of Cardiology, University of Texas Southwestern Medical School for the helpful comments and suggestions.
The statistical tests proposed by Dixon commonly known as Q-test and by Grubbs were used to find outlying observations in the daily measurements of resting and provoked gradient in HOCM.
The observed gradients should follow lognormal distribution because (a) there should be no value below 0, and (b) the distributions are skewed to the right as median < mean (Figures 1 and 2).
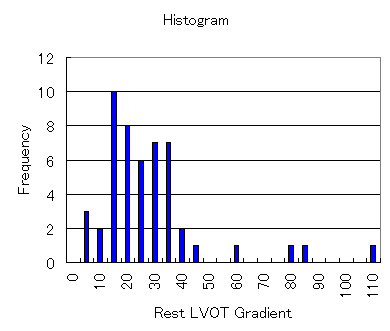
Figure 1. Histogram for the rest LVOT gradient. The
distribution is not symmetric and is skewed to the right. Median=20.5
mm Hg, and mean=23.7 mm Hg.
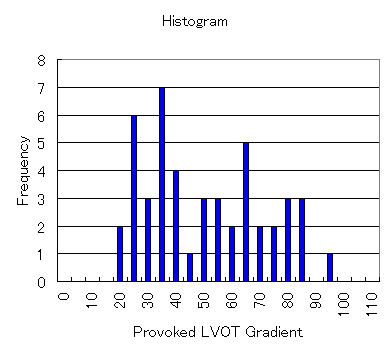
Figure 2. Histogram for the provoked LVOT gradient.
Median=38.5 mm Hg, and mean=48.1 mm Hg.
Under this assumption of lognormality of the data, only the
highest rest LVOT gradient for patient #8 (82 mm Hg) can be
considered "a statistical outlier" although other measurements look
like extreme values (Figures 3 and 4).
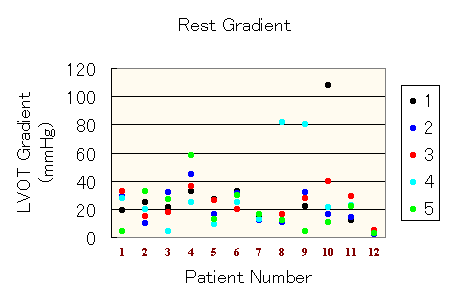
Figure 3. Rest LVOT gradient plotted by patient number. Each dot represents Day.
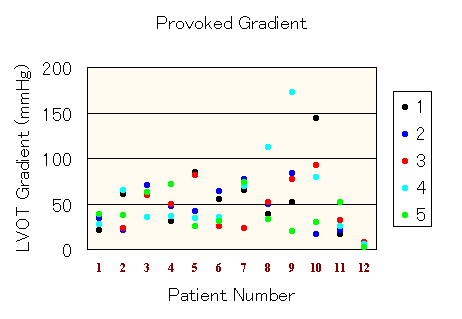
Figure 4. Provoked LVOT gradient plotted by patient number. Each dot represents Day.
Student's t tests were used to determine P values for the differences between the rest and the provoked gradients (log-transformed). For each patient, the mean for the provoked gradients divided by the mean for the rest gradients was computed. This is termed "provoked/rest," and was regressed by P values using single exponential model. The P values for the parameters and ANOVA were < 1%. The following figure was obtained.
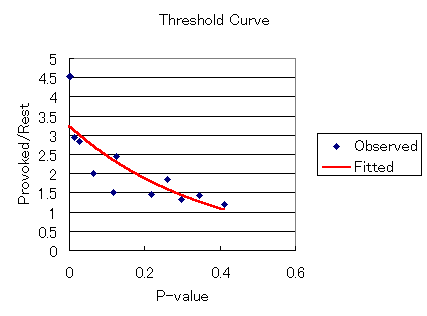
Figure 5. A proposed threshold curve.
The 95% confidence interval at P=0.05 is between 2.46 and 3.22, suggesting that at least 2 to 3 fold increase in mean LVOT gradient may be required as an indication of disease progression. This can imply that at least 1/3 to 1/2 decrease in mean LVOT gradient may be needed to be sure that there has been an improvement or therapeutic benefit.
Å@